Honey bee virus diagnostics


Agarose Gel Immuno-diffusion (AGID)
AGID is based on the principle that when an antigen meets its homologous antibody, coagulation result in a visible, insoluble precipitate. AGID has been largely used in the detection of honey bee viruses (Anderson, 1984; Ribière, 2000; Todd et al., 2007). In a semi-solid agarose gel matrix are present a central well, where the antibody is loaded, and a few lateral wells containing various sample extracts. Both antibodies and antigen will diffuse through the gel matrix and when they come into contact, if they are complementary, they will form a whitish band (Harlow and Lane, 1988). AGID is usually a very simple, fast and even robust method. However, in honey bee virology, due to the cross-contamination problem described in the previous paragraph, only monoclonal antibodies should be used and this unfortunately raises the cost of the analysis. Figure 2 shoes a typical AGID positive reaction
Enzyme Linked Immuno Sorbent Assay (ELISA)
ELISA are popular methods used across many laboratories working on honey bee viruses (Anderson, 1984, 1985; Ball, 1985; Allen et al., 1986; Ball and Allen, 1988; Anderson and Gibbs, 1988, 1989; Kulinčević et al., 1990; Ball and Bailey, 1991; Varis et al., 1992; Allen and Ball, 1995; Topolska et al., 1995; Stolz et al., 1995; Bowen-Walker et al., 1999; Nordström et al., 1999). There are several variations in the protocol available to produce direct plate trapped antigen (PTA), double antibody sandwich (DAS) and triple antibody sandwich (TAS) formats. Generically these protocols comprise directly (or indirectly) adsorbing the target in a well of a plate. Enzyme-linked antibodies are then added. At this point if antigen and antibodies match, an introduction of the substrate for the enzyme linked to the antibody will produce a reaction (change of colour or emission of light) that can be quantified, giving us the amount of antigen present in a certain sample (Allen et al., 1986).
ELISA is a low cost test of simple automation, and can provide quantification of the antigen and therefore virus, present in a certain sample. Besides the problems with poor specificity when using antibodies in honey bee virology, it is also impossible to investigate multiple targets at the same time, and the chance of creating false positives during the washing step by spilling part of the un-bonded antigen of a positive sample in a well containing a negative sample.
There are a variety of diagnostic methods available to diagnose viral diseases in honey bees. Beside the classical diagnostic methods such as the symptomatic evidence, or electron microscopy, it is possible to diagnose a viral disease using serology (protein profile, polyclonal and monoclonal antibodies, Agarose Gel Immuno diffusion (AGID) and Enzyme Linked Immuno Sorbent Assay (ELISA)) or molecular biology techniques (Real Time rt -PCR, rt PCR, microarrays, sequencing, pyrosequencing). Each method has its strengths and its weaknesses, below I describe some of the most commonly used techniques in the diagnosis of honey bee viruses, considering their advantages and disadvantages. Before describing them we need to understand what characteristics a diagnostic test should have. A diagnostic test should be:
Sensitive: rapidly detect the pathogen without giving false negatives.
Specific: detect only the specific pathogen and not cross react with other pathogenic agents (or substrates) giving false positives.
Reliable (robust): insensitive to variations in the protocol or in the environment (e.g. ambient temperature).
Repeatable: give the same (or comparable) results when a single sample is analysed many times (by different people and even in different laboratories).
Universal: detect the pathogen at all life stages and disease state.
Simple: easy to execute and the possibility to use it in the field.
Fast: the early detection of the disease can allow preventive measures to be taken.
Cheap: must be cost-effective.
In reality a perfect test fulfilling all these criteria does not exist because of the high number of variables involved (pathogen, host characteristics, environmental parameters, physic-chemical limits, intrinsic and operator errors).
However, recent years have seen huge advances in the diagnosis of honey bee viruses with detection platforms moving from serology to molecular based approaches. The serology based methods investigate mainly the coat protein on the virus surface that are, in many cases species or even strain specific. The molecular based approaches detect the virus genetic material and are characterized by a high sensitivity and specificity. Perhaps more important than the detection technique used is to have a proper statistically representative sampling plan. Lack of a correct sampling plan, in fact, could render useless data generated from the most sensitive and specific technique.
Serology
The main problem in using antibodies for the diagnosis of honey bee viruses is the lack of a honey bee cell cultures system and the lack of bee samples that are positive only for one virus. This leads to a low specificity of the antibodies produced (polyclonal) as is it very likely that they are derived from a mixture of viruses. For example the monoclonal antibodies, from purified VP4 of KBV, ABPV and IAPV have been generated (de Miranda et al., 2010a), but due to the variability of these viruses they could give false negatives as the VP4 protein is encoded in one of the most variable parts of the viral genome. This led to misidentification with consequent errors and in the calculation of the prevalence and the distribution of KBV\IAPV (de Miranda et al., 2010a). Some of the most used serology techniques to detect the honey bee viruses are discussed below.
Protein Profile
This technique is based on the characteristics of a mixture of linearised proteins to migrate through a polyacrylamide gel separated by molecular weight. The pattern of bands obtained in this way is typical of the virus from which the mixture of protein has been extracted (Laemmli, 1970; Jackman, 1987; Costas et al., 1989; Pot et al., 1989; Vauterin and Vauterin, 1992). This technique, when combined with antibody-based techniques such as the Western Blot, allow the identification of the viral coat protein. In the case of the honey bee viruses, the protein profile can be used only if the viruses have been previously purified because of the very frequent mixed infections that can lead to unspecific protein profiles. In the case of honey bee viruses this is a major issue as many of the virions of different viruses share the same dimensions so is it very difficult, if not impossible, to obtain purified viruses free from contamination. Another problem is that the viral infections are often sub-clinic with a very low titre of virus. In this case, if we want to use the protein profile technique, we need first to use molecular techniques to amplify the region of the genome that encode the protein that we are investigating, express it for example in E. coli, and then purify the protein. This procedure, while it is of great scientific interest because it allow us to investigate the proteome of viruses present at low titres in the host, cannot be routinely used as a diagnostic procedure because it is labour intensive. Figure 1 shows a typical result obtained with 1D SDS PAGE.
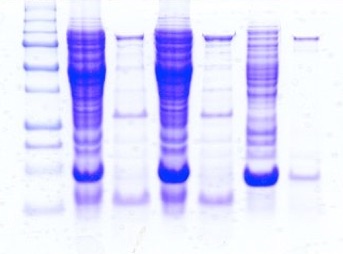
FIG 1: An example of a polyacrilamide gel note the identity of lanes 2 - 4 and 3 -5
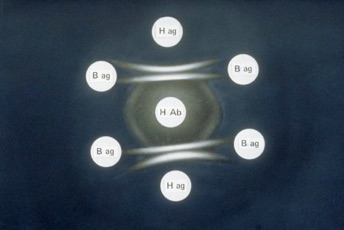
FIG 2: Double immunodiffusion test (AGID). Note the positive reactions (white bands) between H ag and H Ab.
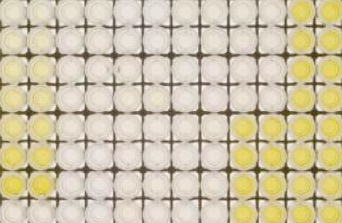
FIG 3: Example of an ELISA test. Yellow wells are posive to the disease (EFB in this case)
Molecular biology
The advent of the molecular biology age partially solved the problem encountered using serology based approach for honey bee virus detection. Molecular techniques tend to be more sensitive and specific than serology based methods. These techniques are not problem free as the variability of RNA viruses can lead to false negatives, but by targeting different assays to different parts of the genome we can overcome this problem. A limiting point for these techniques is the availability of reference sequences deposited in the on-line databases, but in the last few years many sequences of honey bee viruses have been deposited.
There are many molecular techniques available now, some of them allow us to do a multi-target screening (e.g microarrays or multiplex PCR formats) and some of them are based on a non-targeted approach that means that we need no a priori knowledge of the pathogen that we are investigating (pyrophosphate-based sequencing techniques).
The variety of molecular techniques available is massive. Whilst a detailed report of all the available molecular methods is beyond the scope of this thesis, a description of the most commonly used methods for the detection of honey bee viruses is provided.
Reverse Transcriptase PCR (rt-PCR)
rt-PCR is a variant of the polymerase chain reaction (PCR), that allows us to generate many copies of complementary DNA (cDNA) starting from viral RNA. The RNA is firstly reverse transcribed using reverse transcriptase into cDNA that can then be amplified using the traditional PCR. For the PCR reaction we need to design two primers (named for convention Forward and Reverse) that can anneal to a specific point in the viral genome. In this way the DNA polymerase can amplify the sequence included between the primers. A cycle is composed by three phases: denaturation (the double stranded DNA unfolds to a single strand), annealing (the primers bind the target sequence) and elongation (the DNA polymerase adds the complementary bases to the target sequence). Repeating this cycle many times gives an amplification of the target sequence. The results are analysed using the electrophoresis on agarose gel.
Due to its propriety (sensitivity, accuracy, cost-effectiveness, rapidity of execution, repeatability, and reproducibility), rt-PCR and PCR are the diagnostic tests of choice in many laboratories working on honey bee viruses (Evans and Hungh, 2000; Benjeddou et al., 2001; Grabensteiner et al., 2001; Ribière et al., 2002; Ongus et al., 2004; Tentcheva et al., 2004a,b; Antunez et al., 2006; Berenyi et al., 2006; Chantawanakul et al., 2006; Siede and Büchler, 2006; Yue and Genersch, 2006;. Cox-Foster et al., 2007) The principal limit of rt-PCR, when used to investigate RNA viruses, is on the high variability of the viral genome itself. Replication of the genome of RNA viruses incurs many errors. This leads to many mutations within the RNA genome and, when this happens in the area the primers should anneal, reaction would fail. The only solution to this problem is to check the Genbank database frequently and re-design the primers on an area of consensus between all the sequences deposited. It is easy to understand how important is to deposit all the sequences found for progress in research on RNA viruses. Figure 4 shows a typical result from RT-PCR reaction
Real Time rt-PCR (rt-PCR)
This is a technique based on the classical rt-PCR. The difference is that the amplification process is followed in real time and we do not need to wait until the end of the process in order to know the result. Real Time rt-PCR is possible using a double-stranded DNA dye such as SYBR Green or a specific probe designed between the forward and the reverse primer. The use of the double-stranded DNA dye has the limit that it is not sequence specific, so it can bind to any PCR product, leading to possible false detection. The use of fluorescent probes that can bind only to a specific sequence, guarantees the specificity of the result. The probe is composed of a fluorescent reporter at one end and a fluorescence quencher on the other end. As they are very close, the quencher inhibits the detection of the fluorescence whilst the probe is intact, but when the Taq polymerase breaks the probe, the quencher and the fluorescent reporter are no longer close and the fluorescence can be detected by a laser. The result of the reaction can be visualized on a computer connected to the thermocycler. The result is expressed as cycle threshold (Ct) which is the point at which the change in florescence crosses an arbitrary threshold line.
This technique is thousands of times more sensitive than the
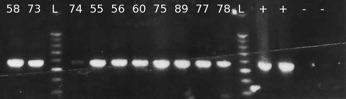
FIG 4: RT-PCR of DWV samples
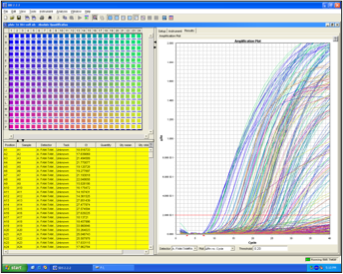
FIG 5: Real Time RT-PCR of DWV samples 384 samples analysed in a single run
classical rt-PCR , very quick, highly automated and it can allow the quantification of the viral load in the samples (Harju et al., 2005; Ward et al.,2004). It is the ideal technique to use for mass screening of samples, but unfortunately the products obtained are usually only of few hundred (100-200) bp, so it is not the best technique to use if we need to characterize our viruses by sequencing. Figure 5 shows a typical result obtained using a Real Time PCR thermal-cycler.
Microarrays
Microarrays technology involves the use of hundreds of molecular probes, bound in a solid, grid-like array, are tested simultaneously by hybridisating the target sequences. The target sequences are labelled with a fluorescent substance (e.g. SYBR-green) and if the sequence hybridise with the specific probe a fluorescence can be detected in the position of the array where the reaction happened.
Diagnostics are moving away from a single organism detection to a survey on the interaction between pathogen and host (de Miranda in Virology and Honey Bee, 2008). The availability of full nuclear and mitochondrial genome of the honey bee and its major pests and pathogens (e.g. Varroa destructor and Paenibacillus larvae) and the future development of the relative microarrays probe, could allow us to study the interaction between host genetic susceptibility and viral diseases (Crozier and Crozier, 1993; Evans and Lopez, 2002; Evans, 2006; Qin et al., 2006).
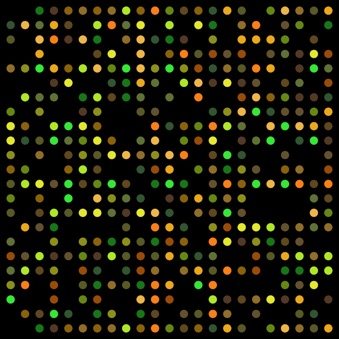
FIG 6: Microarray, how a result look like
The major drawback of microarrays technology is the cost due to the single use that can be done of the array itself. However, part of the cost is recovered considering that a multiplexing analysis can replace many single-sequence tests for different targets.
Sanger sequencing
Using sequencing we are able to identify the sequence of our viral sample generated using rt-PCR. One of the most used sequencing methods is the Sanger method, sometimes referred to as the chain termination method. This method provides sequence infomation up to 1000 bp. To obtain the sequence in the reaction mix we need a template, the primer that generate it, the dNTPs (deoxinucleotides), the DNA polymerases and four differently labelled chain terminators ddNTPs (dideoxyinucleotides) at low concentration. The DNA polymerase incorporates the dNTPs until a ddNTP is randomly incorporated in the sequence, stopping the reaction. In this way we will obtain a pool of sequences that will differ only in length. The products are then subjected to capillary electrophoresis so the shorter sequences will pass through a sensor that can detect the four different labels of the ddNTPs. The sensor sends a signal to a computer that keeps record of the nucleotide order passed through the sensor and at the end of the process generates the electropherogram.
Nowadays, it is possible to run up to 384 samples simultaneously, for a cost of about £4 each. For this reason we can consider it not only as a research tool but also as a diagnostic tool. In fact, discovery of a large piece of genetic code (500-1000 bp) gives us good proof of the presence of a specific pathogen in the sample.
The limit of this technique is on the length of the sequence obtained no longer than 1000 bp. When we have a sequence longer than 1000 bp we can overcome the problem by redesigning the primers using the results of the initial sequencing.
Pyrosequencing
Pyrosequencing is a sequencing method based on the detection of pyrophosphate released when a nucleotide is incorporated by the DNA polymerase. The technique was developed in 1996 by Pål Nyrén and Mostafa Ronaghi (Ronaghi, 2001). It is based on the “sequencing by synthesis” principle, that means that the complementary nucleotides added are incorporated in the growing sequence using the sample to be investigate as a template. The reaction involves the use of four enzymes (DNA polymerase, Sulfurylase, Luciferase and Apyrase) and a substrate (adenosine 5' phosposulfate (APS)). The dNTPs are added singularly and, if they are incorporated by the DNA polymerase in the growing sequence, a molecule of pyrophospate (PPi) is released (one for each nucleotide incorporated). At this point the enzyme Sulfurylase, using the substrate APS, converts the PPi in adenosine triphosphate (ATP). The Luciferase, using the ATP, converts the Luciferin in Oxyluciferin and this generates light that is detectable by the pyrosequencer and converts the amount of light generated (proportional to the nucleotide incorporated) into data that are presented as a pyrogram. The fourth enzyme (Apyrase) degrades the unincorporated nucleotides before adding a new nucleotide.
This technique has many advantages, it is possible to automate, does not require specific primers to work allowing the metagenomic research by generating a huge amount of reads coming from any genetic code present in the sample analysed, using appropriate precaution (e.g. virus purification) and dedicated software for the contigs generation it allows us to sequence full genomes in one run. The only downside to this techniques is the price (currently about one thousand pounds per reaction).


Citation: Cordoni, G.; 2011. Epidemiology and taxonomy of honey bee viruses in England and Wales. PhD thesis. University of Surrey.
Developed by
Dr. Guido Cordoni DVM, PGDip, PhD, MRCVS